What should you know about air quality?
Important background information to the study


NO2 is harmful to the environment: it contributes to the formation of ozone and the acidification of the oceans. It also has a negative effect on our health: exposure to large quantities of NO2 can cause irritation to the eyes, nose, throat and lungs, and in the long term it can impair lung function.
When is air pollution harmful?
In order to limit the effects of air pollution on our health, the European Union has set a maximum limit value for each pollutant. If these limit values are exceeded, there is a risk that poor air quality will have a serious effect on our health. European member states must therefore ensure that residents are not exposed to amounts higher than this maximum limit value. For NO2 this limit value has been 40 µg/m³ since 2010. For this reason, this limit is also clearly indicated on your results poster.
However, research is not standing still. Recent studies into the effects of NO2 exposure provide better insight into the effects on our health. These studies show that NO2 affects our health even at lower concentrations. The World Health Organisation published a new report in September 2021, in which a lowering of the limit value is proposed. The World Health Organisation recommends lowering the limit value in the short term from 40 µg/m³ to 30 µg/m³. Later on, it would be lowered to 20 µg/m³ and even, eventually, to 10 µg/m³. Take a look at the latest report from the World Health Organisation here.
To monitor the evolution of air quality, the Brussels-Capital Region measures air quality throughout the year using 13 measuring stations. Various pollutants are measured in these stations, including ozone, particulate matter, sulphur dioxide and black carbon. Nitrogen dioxide (NO2), the substance we map with CurieuzenAir, is also measured continuously in 10 of these 13 stations.
The past 10 years
Thanks to these continuous measurements, we know that the emission of pollutants in Brussels has decreased in recent years and that air quality has improved considerably. Between 2000 and 2019, a clear decrease of NO2.in the outdoor air was measured in all measuring stations. For example, during this period, the NO2 concentration along a busy road in Sint-Jans-Molenbeek decreased by almost 20%. In the Wilderbos in Sint-Agatha-Berchem, NO2 decreased by almost 40%. Moreover, since 2019, all measured NO2 values comply with the limit value imposed by Europe (40 µg/m³).
The situation today in 2021
Thanks to the enthusiasm of 3.000 CurieuzenAirs, we obtained an overview of the air quality in the entire city for the first time. This provides insight into how many people are exposed to a particular air quality.
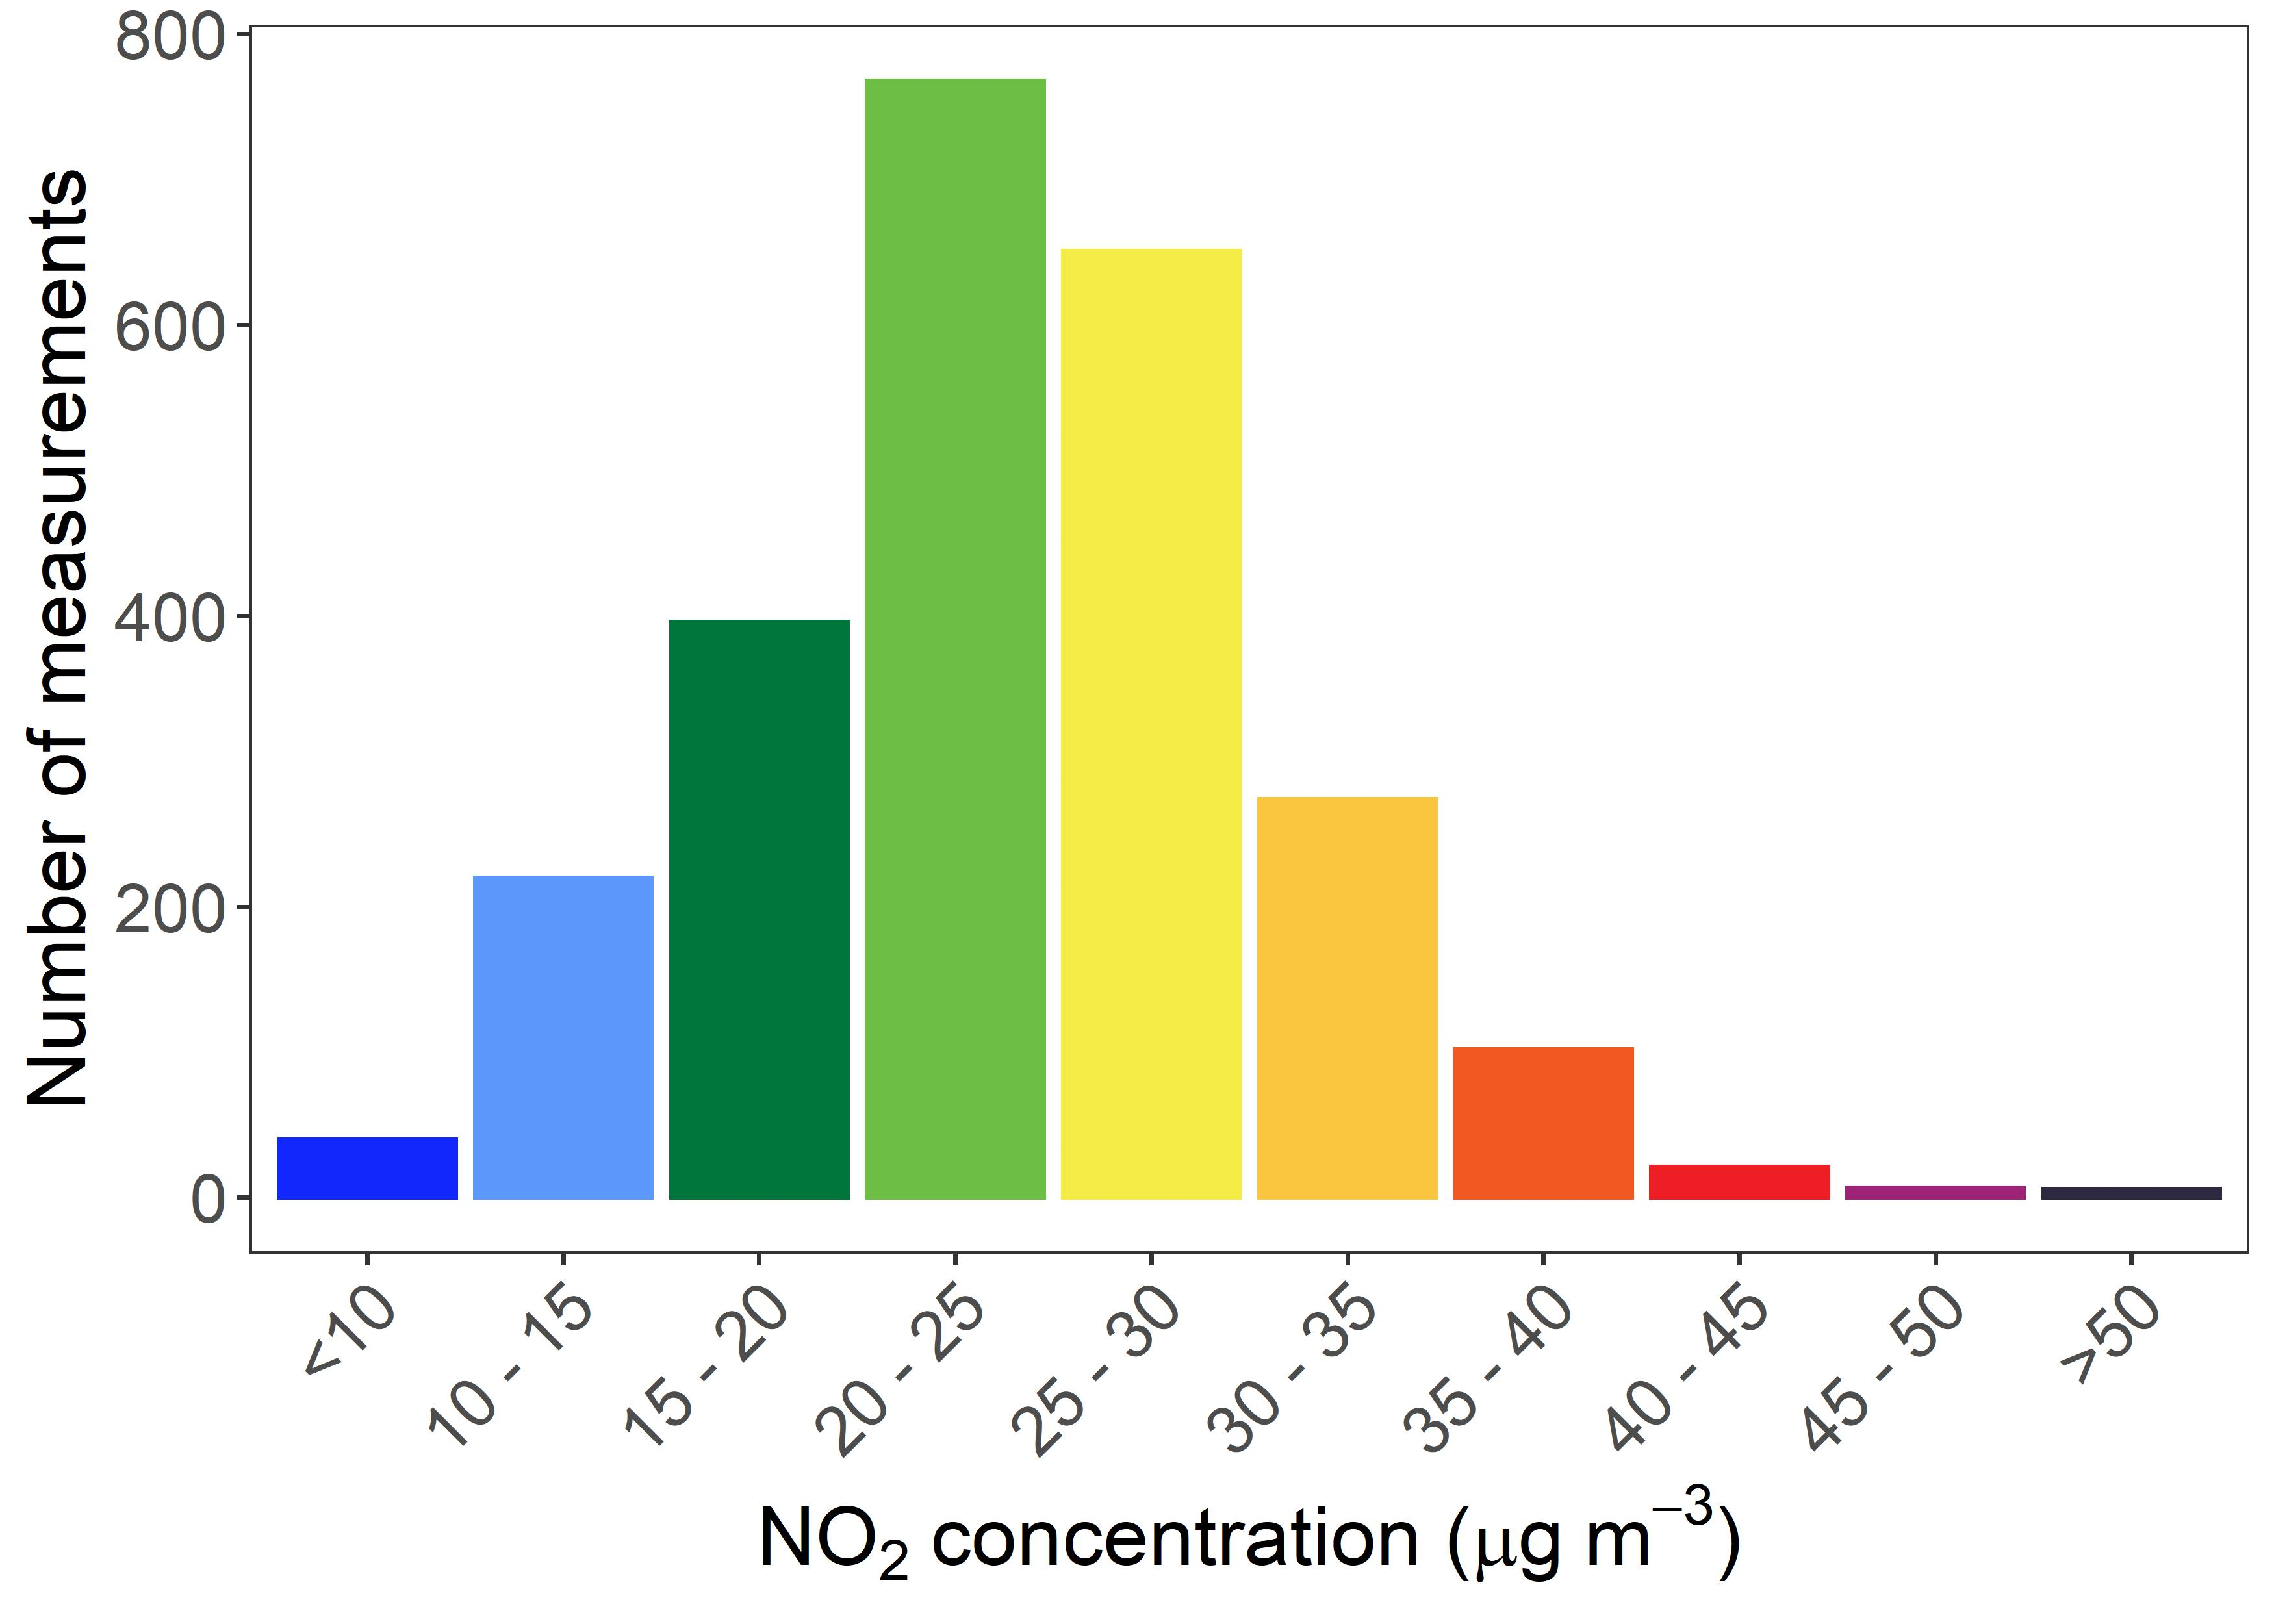
For example, at 1.4% of the measurement locations, a value higher than 40 µg/m³ was measured. This means that today approximately 16,714 Brussels residents live or work in a location that does not comply with the European air quality regulations. In addition, approximately 184,215 Brussels residents, or 15.1% of the Curiosity population, are exposed to high NO2 concentrations (30 – 40 µg/m³).
At 1.61% of the measurement points, corresponding to 19,642 inhabitants of Brussels, the NO2 concentration met the guidelines of the World Health Organisation (< 10 µg/m³). 301,698 Brussels residents (24.7%) live and work in a place with a low NO2 concentration between 10 and 20 µg/m³.
Would you like to know more about air quality in Brussels and Europe?
On the website of Brussels Environment you can follow the measurements of the continuous measuring stations in Brussels. For an overview of the air quality at European level, visit the website of the European Environmental Agency. There you will find an interactive map with an air quality score for various European cities.

Air quality in Brussels is not the same everywhere
The quality of the air you breathe in a city varies greatly from place to place. In streets with a lot of traffic there is more NO2 emission from exhaust gases than in streets that are car-free. Is a street surrounded by high, continuous buildings? Then there is a good chance that the pollutants linger longer, causing concentrations to soar. These streets are called ‘street canyons’. In a park or low-traffic area, there is no traffic and therefore no NO2 emissions. The concentrations can be considerably lower here.
CurieuzenAir has now mapped these differences in detail for the first time for the entire Brussels Capital Region. The highest concentration (60 µg m-3) was as much as ten times greater than the lowest concentration (6 µg m-3). This shows how air quality varies greatly from place to place.
Air quality in Brussels is not always the same
Air quality can vary from hour to hour, day to day and month to month. A crucial role in this is played by the weather: the weather has a major effect on the spread of air pollution. Wind, for example, will disperse and dilute pollution. Rain can flush air pollutants from the air, so the air is often healthier after a good shower than before. On the other hand, on windless days, air pollution can easily pile up.
Besides the direct effect of the weather, there is also an indirect effect. On cold days, there will be more emissions of pollutants because buildings will be heated more and people will take to the car more quickly. On warm and sunny days there is a higher risk of summer smog formation. When there is a lot of sunlight, various pollutants, including NO2, will react to form various harmful substances such as ozone.

The collected NO2 in the measuring tubes can come from various sources. Brussels Environment has investigated the origin of NO2 emissions in Brussels.
NO2 emissions from human activities: 44%
44% of NO2 in the Brussels region is linked to emissions from human activities. The car stands out as the main source of NO2. In 2019, more than 60% of the NO2 emitted in Brussels came from road traffic. Other important sources of NO2 are the heating of homes and businesses and the production of energy. In order to continue improving air quality, stricter emission standards and a renewal of the car fleet are being implemented. The switch from diesel to petrol and electric cars is reducing emissions of particulates and NO2 per kilometre driven. A detailed analysis of the Brussels car fleet is available on the Brussels Environnement website.
NO2 in the atmosphere: 11%
NO2 is also naturally present in the air. This natural NO2 is formed by forest fires or lightning. The quantity of natural NO2 in the atmosphere is called the natural background pollution. This value can only be measured in places not affected by human activities and is equal to the lowest possible quantity of NO2 in the open air. In Brussels, this value is about 11% of the average annual NO2. In order to get a better idea of the background pollution in Brussels, we installed some measuring tubes far away from major roads, like in the Sonian Forest and at the Royal Domain in Laeken. Based on CurieuzenAir, we now know that the background concentration in Brussels is around 8-10 µg/m³.
Imported NO2: 45%
A city is not a hermetically sealed entity. Wind blows across (regional) borders, exchanging NO2 and other pollutants. Air quality is to a large extent dependent on the wind direction. For example, air blowing in from the ocean is often less polluted compared to continental air. In Brussels, the wind often comes from the southwest. It contains a mix of purer sea air and more polluted land air. The exchange of air allows substances to be “imported” to or “exported” from Brussels. In Brussels, approximately 45% of measured NO2 comes from an activity outside the Brussels region.
Every participant is looking forward to receiving good measurement results. Because knowing the air in your street is good is a great comfort. But does a good measurement result really mean that you always breathe healthy air? And is a bad measurement result immediately a reason to panic?
No, the reality is slightly more complex. We only spend part of our time at home. The other places you spend time during the day also partly determine your personal exposure to nitrogen dioxide, also known as NO2. Your total daily exposure to NO2 is the sum of the air you breathe at home, on the way to work, while sitting at school, or while exercising.
The air quality in all these different locations together determines your total exposure. Typically, 1/3 of the exposure happens at home, 1/3 on the way to work and 1/3 at school or work. So someone can live in a street where poor air quality has been measured, but choose to cycle to school every day along quiet green roads. Another person can live in a street with good air quality, but jog every day along a busy road with high NO2 concentrations.
What is the difference between emissions, concentration and exposure?
These terms are used when scientists talk about pollutants, but what do they mean exactly?
- Emissions are the direct quantity of, for example, NO2 emitted into the environment by sources. For example, you can look at the amount of NO2 that a particular car emits.
- The concentration is the exact quantity of a certain substance present somewhere. In any given place, a substance will have a certain concentration.
- Exposure is the amount of a pollutant in someone’s personal, immediate environment.

In October 2021, we mapped NO2 concentrations at 3.000 locations in the Brussels Region. Nitrogen dioxide (NO2) is formed when combustion occurs at high temperature, for example in the engine of a car.
We focus on NO2 because it is an important indicator of air pollution from traffic, where high concentrations can have serious consequences for our health. Moreover, NO2 can be measured with a measuring system that is reliable, simple and can be used on a large scale: the measuring tubes of CurieuzenAir. Two measuring tubes have been mounted on a switch panel, without any further actions or facilities being required.
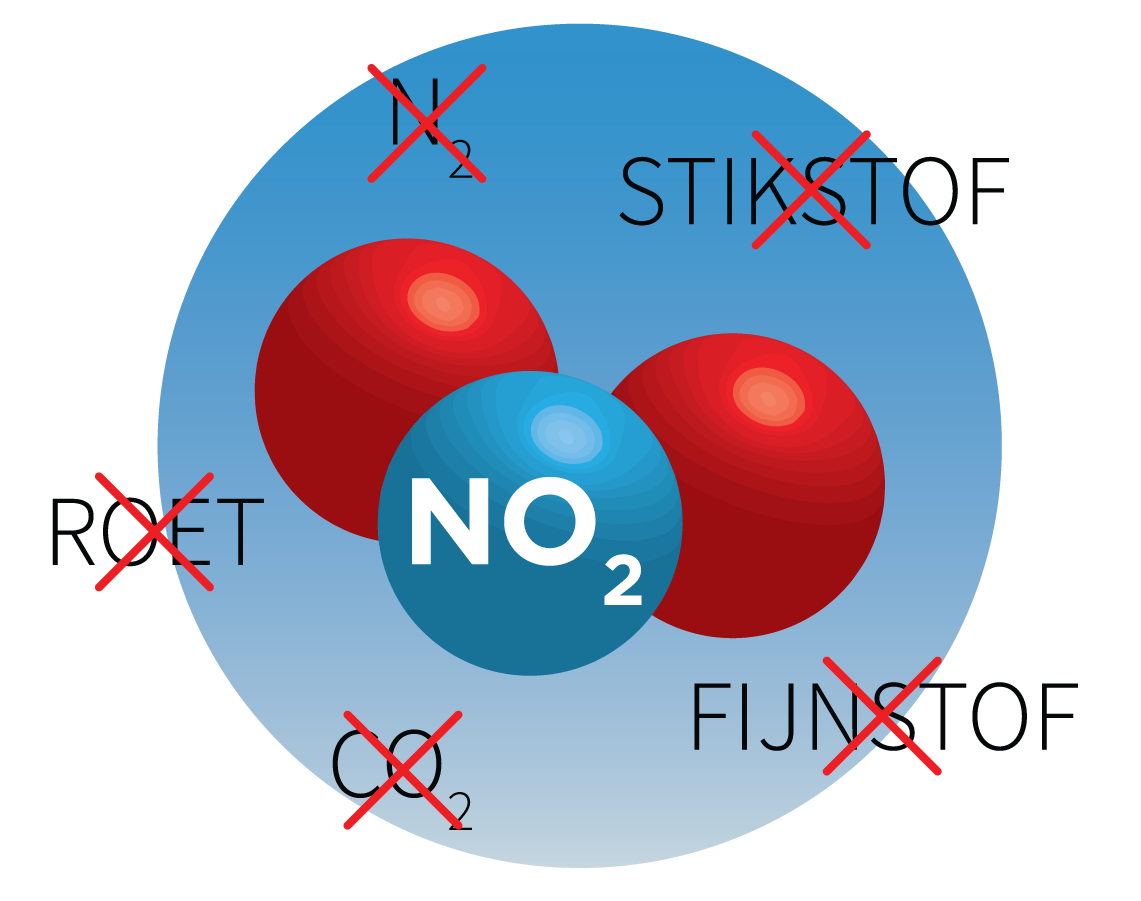
But air quality is more than NO2. Other types of air pollution are also important, such as fine dust (the particles released when wood is burned in stoves) or CO2 (which is a greenhouse gas).
Fine dust: microscopic particles in the air
Fine dust is the collective term for all small suspended particles in the air. Science speaks of particulate matter, PM for short. The particles are divided into groups according to their size. Thus PM10 includes all particles smaller than 10 µm and PM2.5 all particles smaller than 2.5 µm. The smaller the particle, the longer it can remain in the atmosphere, the further it can travel from its source and the deeper it can penetrate into our airways. Larger particles are more quickly precipitated by gravity or washed out of the air by rain.
Particulate matter such as sea salt and pollen is produced in nature. However, man is primarily responsible for a large proportion of the fine dust emissions. The best known source of household particulate emissions is probably the heating of homes with wood-burning stoves. Putting wood in your stove for three hours at home releases more fine dust into the air than when a heavy truck drives from Brussels to Paris. Yet traffic is also a source of particulate matter. In a car, particulate matter is released during combustion in the engine, and friction between the tyres and the road causes particles to be emitted. In the Brussels Region the heating of homes and businesses is responsible for more than half of the particulate matter emissions.
Want to know more about particulate matter in your neighbourhood? Other citizen science projects such as Luchtpijp (in Dutch) offer you the chance to tinker with your own PM sensor. This sensor continuously measures the amount of particulate matter in the air and sends this data live to the website.
CO2: the best known greenhouse gas
Carbon dioxide or CO2 is probably one of the best known types of air pollutants because of its role in the greenhouse effect and the ensuing climate change. CO2 is released during combustion of biological (such as wood) or fossil (such as petrol, diesel, heating oil or natural gas) fuels.
CO2 is naturally present in the atmosphere as a greenhouse gas. It traps heat and thus helps to keep the temperature of our planet in balance. However, human activities bring additional greenhouse gases into the atmosphere, increasing their concentration. This strengthens the natural greenhouse gas and warms up the earth even more.
So CO2 should not be confused with NO2. Emissions of both gases must be reduced, but it is only NO2 that has a clear direct health effect when exposed. With CO2 the health effects are indirect, originating from global warming.


